
Marketing Dashboards See what actually brings in enquiries – and improve what does not.
For you if: When the team spends too much time on manual reporting or debates numbers with inconsistent definitions.

Agreed in writing before we start.
- KPI and definition workshop
- Data-source and connector plan
- Dashboard structure and filters
- Data-quality/refresh QA
- Documentation and reading guide
When reporting takes too long and teams use different definitions.
We bring agreed KPIs into a clear dashboard and document data sources, definitions and limitations.
Four clear steps.
- Review
We map goals, needs, data and what should be prioritized.
- Scope & price
You receive deliverables and the agreed price in writing before work starts.
- Build
We produce, test and let you approve along the way.
- Growth
We measure, learn and improve what actually matters.
What the written offer looks like.
- KPI and definition workshop
- Data-source and connector plan
- Dashboard structure and filters
- Data-quality/refresh QA
- Documentation and reading guide
Read more for your industry
Three decisions before we recommend a scope.
When this fits
When the team spends too much time on manual reporting or debates numbers with inconsistent definitions.
First decision
KPI definitions, data source, owner and refresh cadence need to be agreed before visualizations are built.
When we should choose something else
If measurement is unreliable or data volume is too weak, the data foundation should be improved before drawing strong conclusions.
How we move from observation to improvement.
Question & measurement
We document the definition, data source and refresh cadence for each important metric before visualizing it.
Data quality
We connect this part to a clear metric or hypothesis and document what the data actually supports.
Hypothesis & priority
We document the definition, data source and refresh cadence for each important metric before visualizing it.
Implementation / test
We test critical user flows, mobile behaviour and technical requirements before launch or handover.
Interpretation & decision
We connect this part to a clear metric or hypothesis and document what the data actually supports.
Data quality, hypotheses and interpretation.
Data foundation
data sources, KPI definitions, access levels, report users and desired refresh cadence
Decision signals
data consistency, refresh cadence, KPI coverage and how quickly the team can make decisions
Uncertainty & interpretation
Measurement depends on correct implementation, consent and data access. Experiments are interpreted according to actual data volume and uncertainty — not as guaranteed uplifts.
Next services that can genuinely connect with this one.
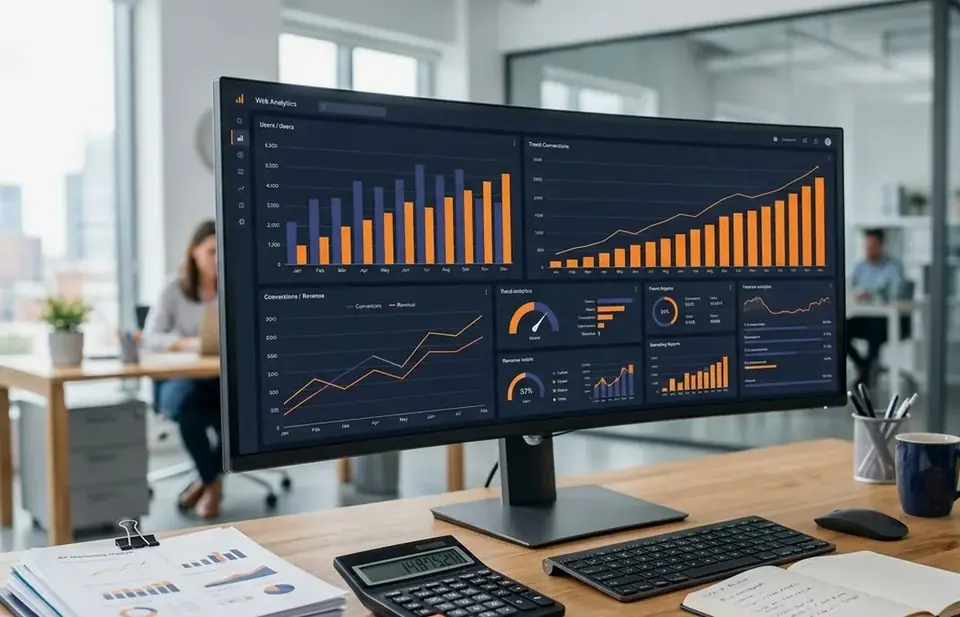
Web Analytics
Measure what matters: leads, traffic, actions and channel contribution.
Learn more →
Marketing Strategy & Consulting
Prioritize goals, channels, messaging and measurement before increasing spend.
Learn more →
CRM Setup
Lead stages, fields, processes and integrations that simplify follow-up.
Learn more →Practical questions about Marketing Dashboards
When is Marketing Dashboards the right next step?
When the team spends too much time on manual reporting or debates numbers with inconsistent definitions. KPI definitions, data source, owner and refresh cadence need to be agreed before visualizations are built.
What do you need from us before starting?
We clarify data sources, KPI definitions, access levels, report users and desired refresh cadence. If something is missing, we explain what can be done without it before scope and price are approved.
What do we concretely receive?
The core delivery is normally built around KPI and definition workshop, Data-source and connector plan, Dashboard structure and filters. Exact included and excluded work is confirmed in writing before starting, and we follow relevant signals such as data consistency, refresh cadence, KPI coverage and how quickly the team can make decisions.
How certain can we be about the effect?
Measurement depends on correct implementation, consent and data access. Experiments are interpreted according to actual data volume and uncertainty — not as guaranteed uplifts.
Get a free quote for Marketing Dashboards
Tell us briefly about your business and what you need. We will send you a fixed price in writing, usually within two working days.
- No obligation, no lock-in
- Fixed price before work starts
- We help businesses across Norway – remotely, with a fixed price